Garbage collection: the pause you didn't schedule
Garbage collection is sold as the feature that lets you forget about memory. It removes a whole class of bugs - use-after-free, double-free, the leak you forgot to plug - by taking the decision of when memory is safe to reclaim out of your hands. That is a real gift. But nothing is free: you pay for it in a currency that stays invisible until the system is under load, and then shows up as pauses, burned CPU, and memory you cannot use.
What the collector is actually doing
At its core the collector answers one question, over and over: which objects can the program still reach? It starts from the roots - the stacks of running functions, global variables - and follows every reference. Anything reachable is live and kept; anything the walk never touches is garbage and can be reclaimed.
flowchart LR
  R([roots]) --> A[A] --> B[B]
  A --> C[C]
  D[D] --> E[E]
  classDef dead stroke-dasharray:5 5,color:#b23b2a,stroke:#b23b2a;
  class D,E dead;
D and E still point at each other, but nothing reachable points at them, so they are garbage - which is exactly why reference counting alone cannot catch a cycle. The important part is the timing: memory is not freed the instant you drop the last reference. It is freed later, in a batch, on the collector’s schedule. That phrase - later, in a batch, on a schedule you don’t control - is the whole story of what GC costs.
The three costs
Automatic memory is a trade, like everything in Latency vs Throughput vs IOPS: why your fast API still fails at scale. You are spending three resources to buy back safety and convenience.
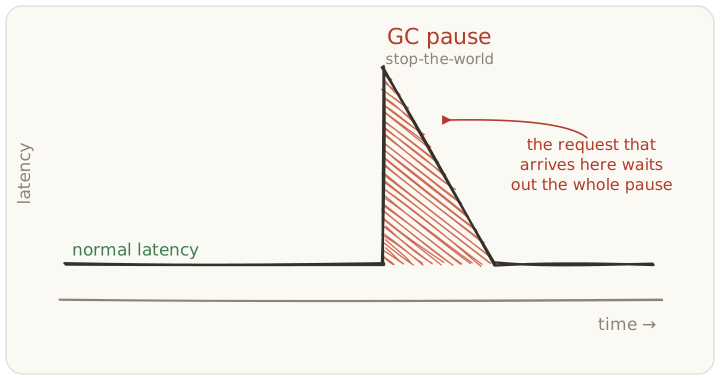
- Latency. To reclaim safely, a collector historically has to freeze the program - a stop-the-world pause - so the object graph does not shift under it mid-walk. That pause lands at a moment you did not choose, and the request unlucky enough to arrive during it waits the whole thing out. This is one of the cleanest sources of Tail latency: the number the average hides there is.
- Throughput. The collector runs on the same cores as your program. Every cycle it spends tracing and reclaiming is a cycle your code did not get. Collect more often for shorter pauses and you spend more total CPU; collect less often and the pauses grow.
- Memory. A collector needs headroom to work. Run the heap close to full and it collects constantly; give it room and it collects rarely. You are trading RAM for pauses, directly.
Why modern collectors are concurrent
Most of GC’s history is the fight to shrink that pause. The move that matters is doing the tracing concurrently - walking the object graph while the program keeps running, so the stop-the-world window shrinks to sub-millisecond. Go’s collector, and Java’s G1, ZGC, and Shenandoah, all trade some throughput (coordinating with a running program is more work) to pull latency down. It is the same dial as above, turned deliberately: pay in CPU to stop paying in pauses.
The other big lever is the generational hypothesis: most objects die young. So collectors carve off a small “young” region, collect it often and cheaply, and only occasionally do the expensive full pass. Cheap frequent collection of short-lived garbage keeps the costly work rare.
What you can actually do about it
You do not tune a collector by guessing. A few moves pay off in order:
- Allocate less on the hot path. The cheapest collection is the one that never runs. Reuse buffers, avoid producing a fresh pile of garbage per request, and the collector wakes up less often.
- Give it headroom. Size the heap so collection is occasional, not constant. A GC thrashing against a too-small heap is a self-inflicted wound.
- Measure the tail, not the mean. GC shows up in p99 and p99.9, never in the average - so watch the percentiles, exactly as Tail latency: the number the average hides argues.
- Match the collector to the goal. A throughput collector and a low-latency collector are different tools; pick for what your service actually needs.
The bottom line
Garbage collection does not make memory management free. It moves the cost - from bugs you write by hand to pauses you tune under load. That is usually a trade worth making, and it is a genuinely good one for most software. But “automatic” is not “absent.” Knowing where the cost went - latency, throughput, or memory - is the entire skill.
Related
- Tail latency: the number the average hides - GC pauses are a textbook tail spike
- CPU-bound vs IO-bound - the collector competes with your code for the CPU
- Threads vs coroutines: who decides to yield - the runtime that schedules your tasks also collects their garbage
- How Programs Actually Run MOC - the runtime layer this note belongs to
- Performance & Latency MOC - the map these notes hang from